Watching Redis
Name a Redis connection and every collection reads its INFO: what each command costs, hits against misses, memory and when it runs out, keys for each database, and fourteen events.
Name one of the connections in config/database.php and every collection reads that Redis server's
INFO beside MySQL's performance_schema, and keeps what moved in the same history:
SAILFISH_REDIS_CONNECTION=default
SAILFISH_REDIS_TIMEOUT=2   # seconds to connect or answer before the read counts as failed
INFO all is one round trip, and costs Redis nothing that grows with its keyspace. Sailfish never scans
keys. It works over phpredis or predis, on a single server or a replica. A cluster connection is refused. Nothing
needs installing on the Redis side.
The Redis page#
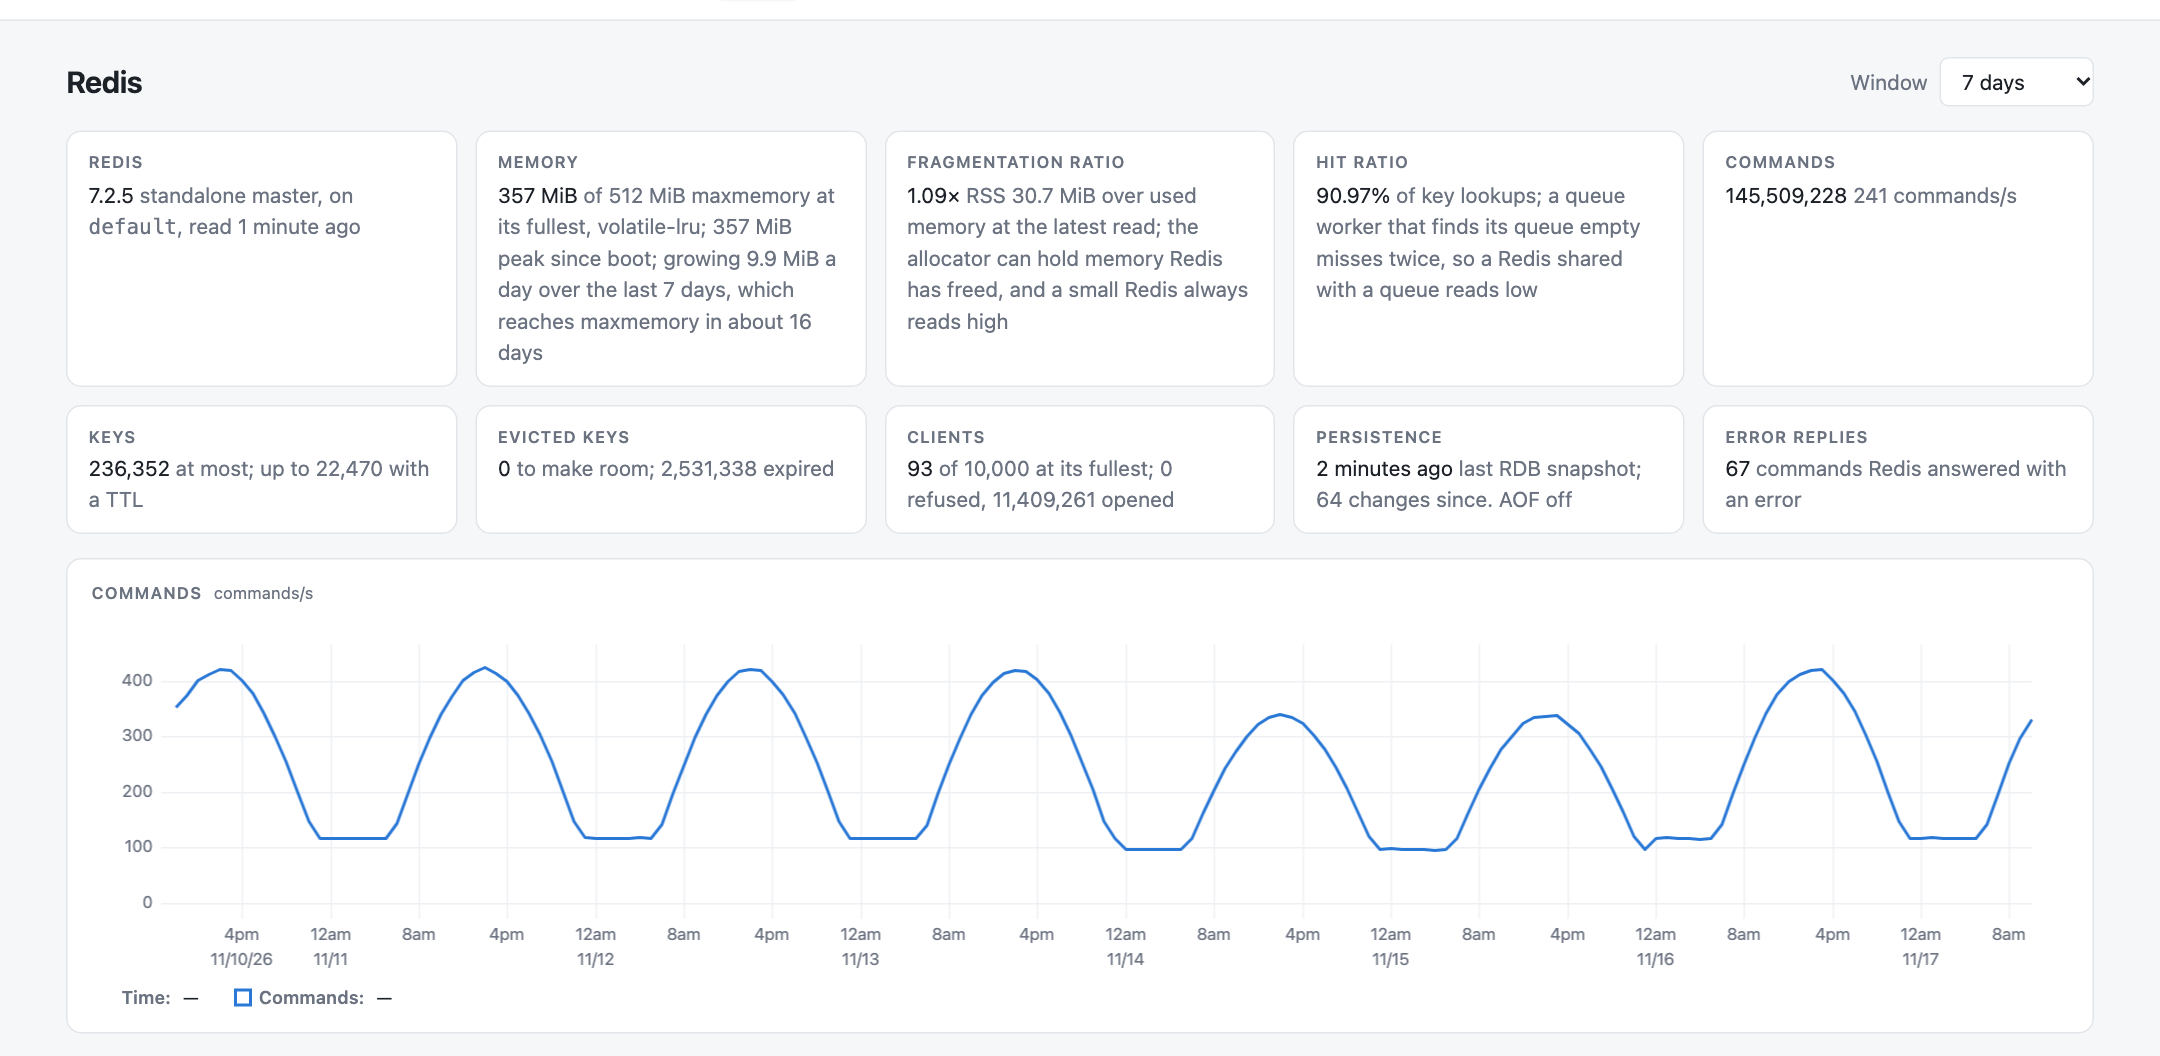
Across the top: the version, mode, replication role and link, and eviction policy; memory against
maxmemory and its peak since boot; the hit ratio; commands; keys and how many have a TTL; keys evicted
and expired; clients against maxclients; when RDB last saved, what is unsaved and whether a save or an
AOF write failed; and commands answered with an error.
Beside memory, how fast it grew over the last 7 days, as a straight line through every reading, and when at that
pace it reaches maxmemory. A Redis without maxmemory is said to grow until the host runs
out. Growth under 1% over the week, or a limit more than a year off, is not forecast. Beside that is the
fragmentation ratio as of the latest read: resident memory against used memory, below 1 when part of Redis may be
swapped out.
The charts cover commands, the time spent running each command, key lookups, memory, keys evicted and expired, keys, clients, connections opened and network traffic. They mark Redis restarting, another server answering behind the connection, and failovers, rather than MySQL's restarts and schema changes.
Commands and what each costs#
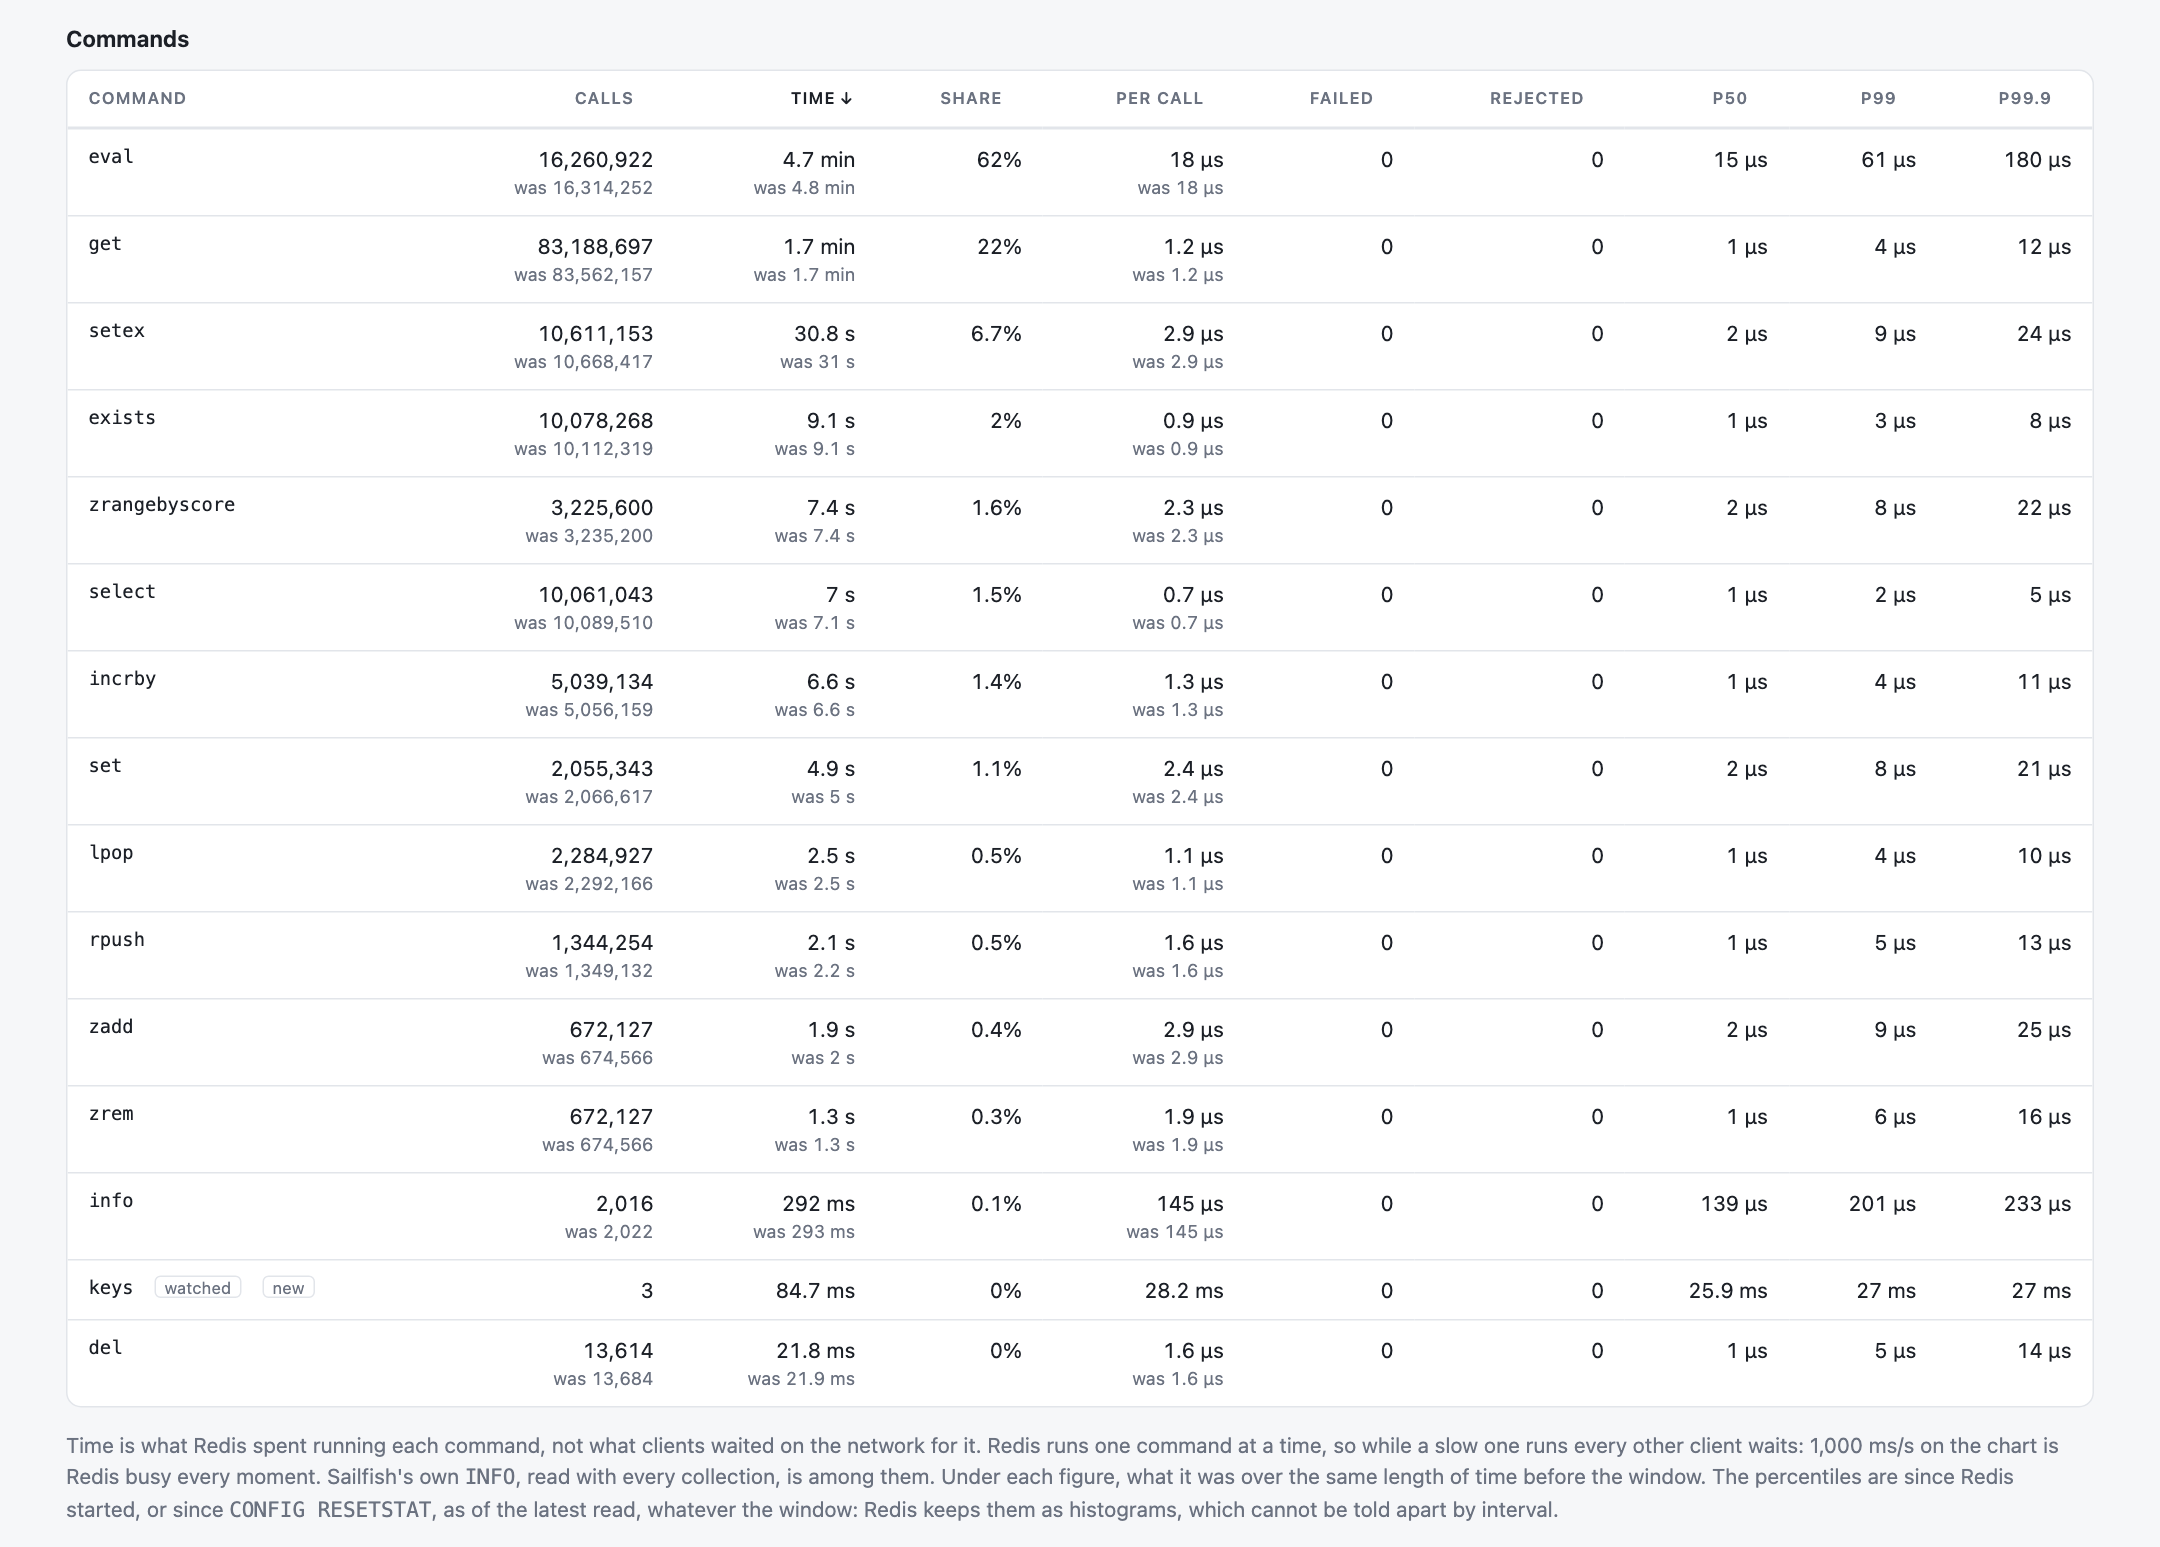
INFO all includes commandstats, a line for each command that has run. The Redis page charts
the time spent by the eight commands that took the most, and the rest as one line. Redis runs one command at a time,
so while a slow one runs every other client waits: 1,000 ms/s on that chart is Redis busy every moment.
The Commands table lists every command with its calls, time, share of Redis's time and time per call, each against
the same length of time before the window, and its failed and rejected calls on Redis 6.2 and later. With Redis 7 it
shows each command's p50, p99 and p99.9. Those are histograms Redis keeps since it started, as of the latest read,
and cannot be split by interval. KEYS, FLUSHDB and FLUSHALL are marked.
Commands go by the name Redis gives them, client|list for a subcommand from Redis 7, and Sailfish's own
INFO is among them.
Keys by database#
Keys, and how many have a TTL, are kept for each database. Laravel puts the cache on database 1 and everything else
on 0 by default, so this is the cache against the queue and sessions. The page names each database by the
connections in database.redis that select it, as in db1, cache, and the Keys chart draws a
line for each, with a dashed one for its keys with a TTL. Past eight databases, those with the fewest keys share a
line.
A connection counts only with the host and port of the one Sailfish reads, compared as written, so a name that resolves to the same server goes unnamed rather than a database being named wrongly. Hits, misses, memory and evictions are the server's: Redis keeps none of them by database.
The hit ratio and the queue#
A low hit ratio is not always the cache. Laravel's queue workers miss twice each time they find a queue empty, on its
:delayed and :reserved sorted sets, so a Redis shared with a queue reads low, and the page
says so beside the figure. The miss surge event asks for more than misses for each hit: misses above their usual and
hits at least 25% below theirs, as when a cache stops hitting. A cache that already hits nearly always has few hits
to lose, so 99% falling to 90% stays quiet. For what each group of cache keys does, see the
Cache page.
Restarts, other servers and failovers#
Counters are kept as deltas, like MySQL's global status. A restart, seen as a new run_id and a short
uptime, counts from zero, and CONFIG RESETSTAT resets each counter it zeroed. A new run_id
on a server that has been up a long time is another server behind the same name, and gets a new baseline.
Another server that is a promoted replica of the one before, as when a failover moves the connection's endpoint, is marked as a failover: a promoted replica keeps its old master's replication ID. So is another server that is a replica where the one before was a master, since what the application reads may lag and its writes fail. A restart is dated by when Redis booted; the other two by the read that saw them, since Redis does not say when they happened. A restart opens a Redis restarted event.
When Redis cannot be read#
A Redis that cannot be read fails nothing else. Sailfish reads it over a connection of its own that gives up after
SAILFISH_REDIS_TIMEOUT seconds, so a Redis that does not answer cannot hold up a collection. MySQL is
still collected, sailfish:collect warns, the Redis page shows the error, and open Redis events stay open
until a read succeeds. What moved in between is spread over the intervals missed rather than charted as one spike.
Events#
| Event | When | Severity | Sent |
|---|---|---|---|
Redis memory fullredis_memory_full |
Redis used at least 90% of maxmemory at a collection in the last hour. Turn it off for a Redis used only as an LRU cache, which runs full by design. | warning | Immediately |
Redis clients running outredis_clients_saturated |
Any connection refused at maxclients in the last hour, or 80% of them open at a collection. | critical | Immediately |
Redis persistence failingredis_persistence_failing |
The latest RDB snapshot or AOF write failed. | critical | Immediately |
Redis replica link downredis_replica_link_down |
The Redis read is a replica whose link to its master has been down for 2 minutes (30 during a full resync), so it serves stale data. | critical | Immediately |
Redis swappingredis_swapping |
Resident memory below 90% of used memory at two collections in a row: part of Redis is swapped out, and every command that touches it waits on disk. | critical | Immediately |
Redis miss surgeredis_miss_surge |
Misses for each hit over the last hour at least 3× the usual for that hour, at least 3,600 misses, and hits at least 25% below usual. Not misses alone: a queue worker that finds its queue empty misses twice, so more workers add misses without taking any hits away. | warning | Immediately |
Redis error surgeredis_error_surge |
Commands answered with an error over the last hour at least 3× the usual for that hour, and at least 100. Redis 6.2 and later. | warning | Immediately |
Redis commands droppedredis_commands_dropped |
Commands over the last hour at most a quarter of the usual for that hour and of the same hour a week before, on a Redis that usually runs at least 3,600 an hour: the application or its workers stopped talking to it. | warning | Immediately |
Redis dangerous commandredis_dangerous_command |
KEYS, FLUSHDB or FLUSHALL ran since the previous collection. It says how often, the databases that lost most of their keys, and for FLUSHDB that php artisan cache:clear runs it. No recovery is sent. | warning | Immediately |
Redis restartedredis_restarted |
Redis restarted in the last 24 hours. It says whether Redis came back without most of its keys, as one without persistence does, so the misses that follow read as a cold cache. | info | Daily digest |
Redis eviction surgeredis_eviction_surge |
Keys evicted over the last hour at least 3× the usual for that hour, and at least 3,600. | warning | Daily digest |
Redis keys without a TTLredis_keys_without_ttl_growing |
Keys without a TTL grew by at least 10,000 over the last 7 days, to at least 1.25× as many, with no one day half of it: Cache::forever() or a SET without EX leaking, not a bulk load. It says when memory reaches maxmemory at that pace. | warning | Daily digest |
Redis memory fragmentedredis_memory_fragmented |
Resident memory at least 1.5× used memory, and at least 256 MiB over it, at two collections in a row. A small Redis, which always has a high ratio, stays quiet. | warning | Daily digest |
Redis command slowerredis_command_slower |
A command's time per call over the last hour at least 3× its time per call at that hour on the previous 7 days, with at least 100 calls in each: a hash, set or list read whole that keeps growing, or larger values. | warning | Daily digest |
The surges compare the last hour with the same hour on the previous days, as the MySQL ones do, but only over the time Redis was read, and only once it has been read on all of those days. A Redis added to an install already collecting waits for its own window, which the Events page counts down. Each surge says when Redis restarted within the hour. A dangerous command event stays open while every collection finds the command ran, counting the calls, and sends no recovery: once it has run, there is nothing to recover from.
'redis_memory_full' => ['enabled' => true, 'ratio' => 0.9],
'redis_clients_saturated' => ['enabled' => true, 'ratio' => 0.8],
'redis_restarted' => ['enabled' => true, 'open_hours' => 24],
'redis_miss_surge' => [
    'enabled' => true,
    'history_days' => 7,
    'ratio' => 3,
    'min_per_hour' => 3_600,
    'min_hits_lost' => 0.25,
],
'redis_eviction_surge' => [ /* ... */ 'min_per_hour' => 3_600 ],
'redis_error_surge' => [ /* ... */ 'min_per_hour' => 100 ],
'redis_commands_dropped' => [ /* ... */ 'ratio' => 4, 'min_per_hour' => 3_600 ],
'redis_keys_without_ttl_growing' => [
    'enabled' => true,
    'days' => 7,
    'min_growth' => 10_000,
    'min_ratio' => 1.25,
],
'redis_swapping' => ['enabled' => true, 'ratio' => 0.9],
'redis_memory_fragmented' => [
    'enabled' => true,
    'ratio' => 1.5,
    'min_wasted_bytes' => 256 << 20,
],
'redis_dangerous_command' => [
    'enabled' => true,
    'commands' => ['keys', 'flushdb', 'flushall'],
],
'redis_command_slower' => [
    'enabled' => true,
    'history_days' => 7,
    'ratio' => 3,
    'min_calls' => 100,
],
For a Redis used only as an LRU cache, which runs full by design, turn redis_memory_full off; the
eviction surge still speaks for it. The swapping and fragmented events take two collections in a row to open, and
two to clear.