The dashboard
The three pages, what the charts draw, and the settings for where the dashboard lives and who can open it.
The dashboard is served by your application at /requizon, with its own views, stylesheet and script, so
it does not depend on your front-end build. It has three levels, each one a drill-down from a row of the one above.
The three pages#
| Page | Lists | Reads |
|---|---|---|
/requizon |
Every API, one row per host, with totals, success rate, average duration and failure count | The hourly rollup |
/requizon/{api}/paths |
The API's paths, most failures first. Opened from a host row, only that host's paths | The hourly rollup |
/requizon/{api}/requests |
Individual calls, newest first, with a Details panel on every row that stored something behind it | The detail table, 50 rows a page |
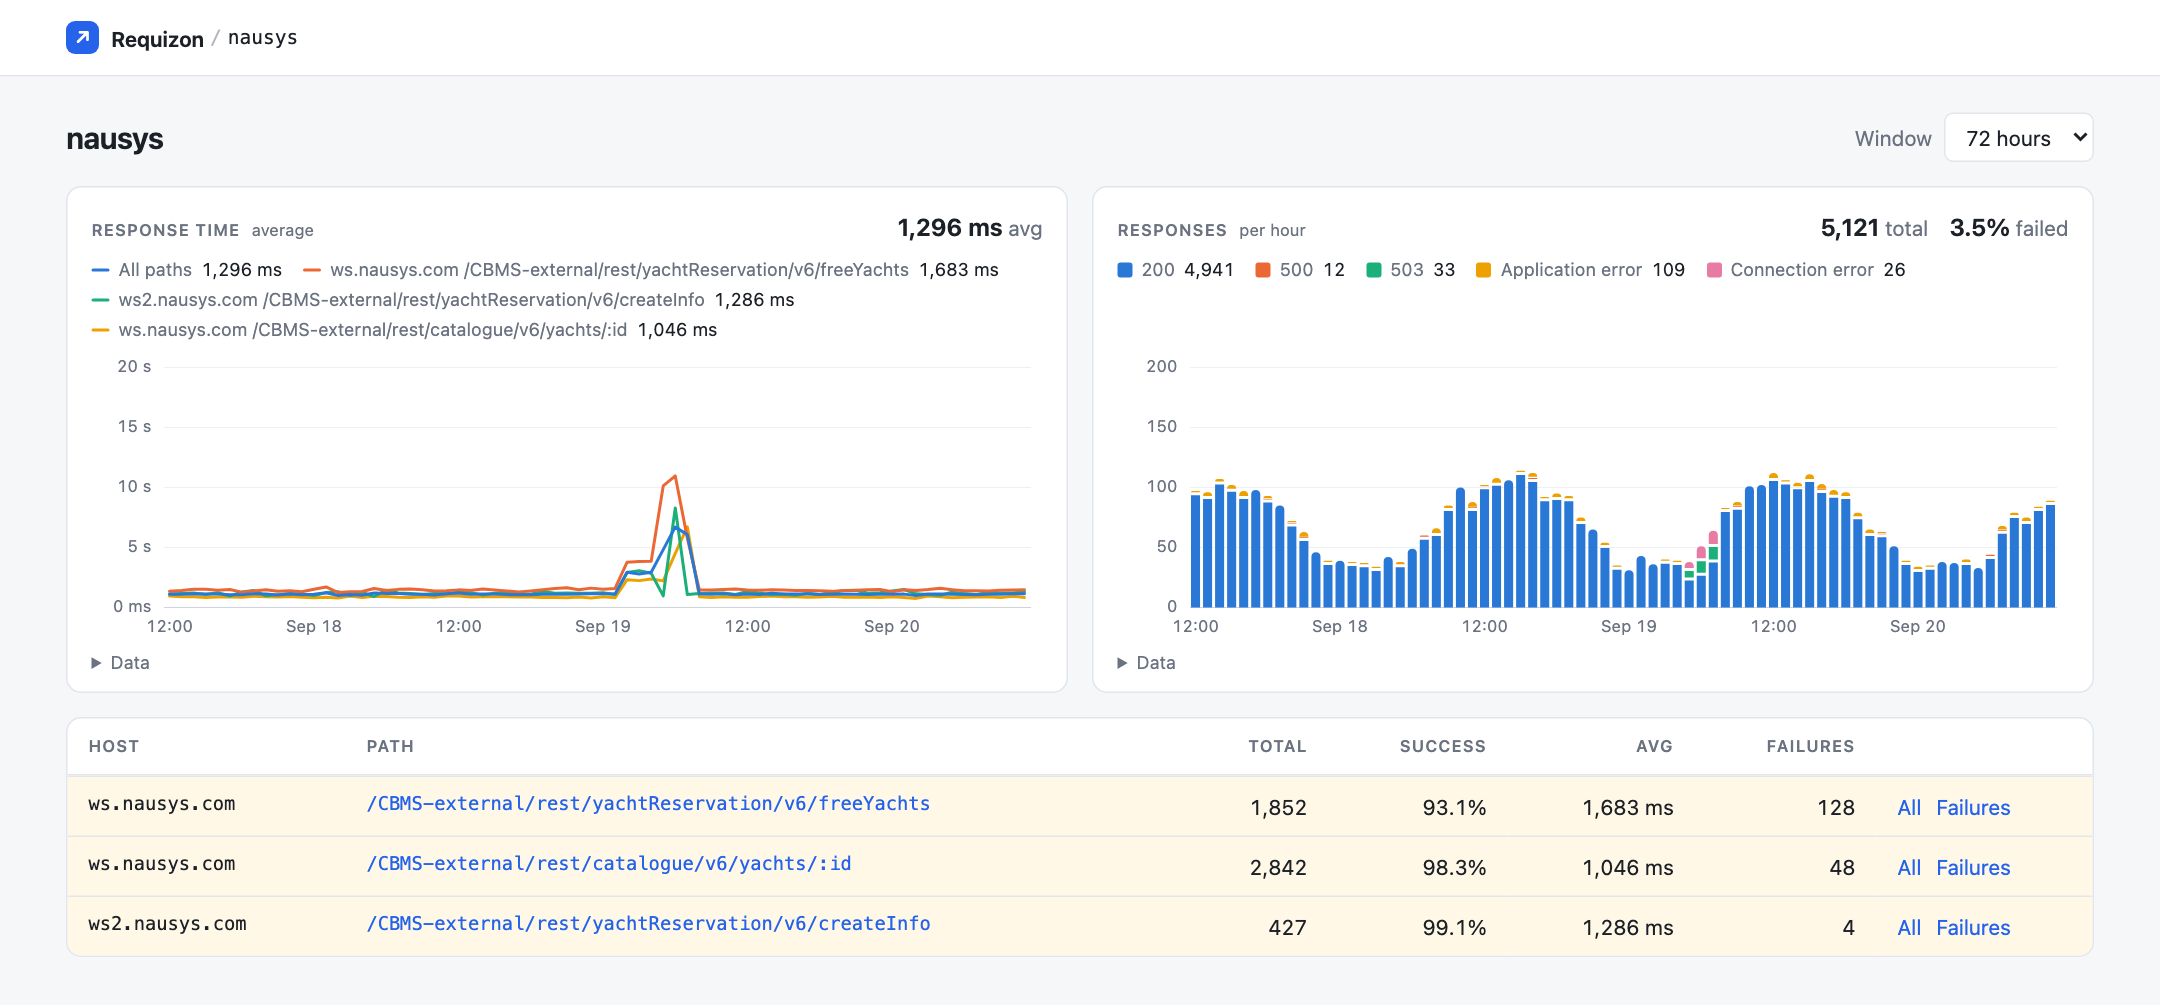
The overview and paths page read the rollup, so a call made in the current hour appears there once the hour has
ended and requizon:aggregate has run. The
requests list reads the detail table and is current to the last call.
The charts#
Every page draws the same two charts over the selected window:
- Response time: the average across everything on the page, plus a line for each of the three slowest members. APIs on the overview, paths on the paths page, and on the requests list whatever its filters leave.
- Responses: calls per bucket, stacked by status code or failure type, so the height of each column is the request volume. The seven most frequent outcomes get their own colour and the rest are folded into Other.
Each chart has a Data disclosure underneath with the numbers behind it as a table. Windows longer than four days are drawn in wider buckets (two hours for a week, four for a fortnight), so a fortnight stays readable.
Filtering the requests list#
The requests list filters by host, path, outcome, status code and a date range. Host and path match exactly, using the values as stored, which is why the links from the paths page are the easiest way in.
-
An outcome or status filter narrows the responses chart to the matching calls, so filtering to
503charts only 503s per hour. Response time is not recorded per outcome, so that chart is hidden while one is applied. - A date range replaces the window, widened to whole hours at both ends, because the charts are drawn from hourly buckets.
Opening a row#
A row in the requests list carries a Details button whenever anything was stored behind it. The panel it opens holds these blocks, in this order, and prints each one only when the row has it:
| Block | What it shows |
|---|---|
| Failure | The message the call was classified with |
| Request headers | The headers we sent, as far as header capture kept them |
| Query | The query string, redacted, whatever the method was |
| Body | The parsed request body, redacted |
| Response headers | The headers that came back, as far as header capture kept them |
| Response body | The body of a call recorded as a failure |
Query and body come from separate columns and are filled for every method, so a POST that also carries a
query string shows both, and a name that appears in each is shown in each. Both blocks are
redacted by parameter name before anything is stored.
Headers are printed the way they went over the wire, one line per value, so a response that set four cookies shows
four Set-Cookie lines instead of one joined string. Which of them reach the panel is decided by
header capture, which out of the box keeps the response
headers of failed calls and no request headers at all.
Windows#
// config/requizon.php
'dashboard' => [
    'windows' => [24, 72, 168, 336],   // hours offered by the selector
    'default_window' => 72,
    'per_page' => 50,
],
A default_window that is not in windows falls back to the first entry, so the selector never
claims one window while showing another. Offering a window longer than retention.detail_days works for
the charts, which read the rollup, but the requests list will not reach that far back.
Access#
Every dashboard route runs through the middleware in requizon.middleware (['web'] by
default) and then Requizon's own check, which answers 403 to anyone it does not let in. The check your
published RequizonServiceProvider installs is:
- In the
localenvironment, everyone. - Anywhere else, whoever the
viewRequizongate allows, and nobody until you define it.
protected function gate(): void
{
    Gate::define('viewRequizon', fn ($user) => in_array($user->email, [
        'ops@example.com',
    ]));
}
The gate receives the authenticated user, so a guest is refused without the closure running. For a check that is not
about a user at all (an IP allow-list behind a VPN, say), replace the whole callback in the provider's
boot() method, after parent::boot():
use BoringO11y\Requizon\Requizon;

Requizon::auth(fn ($request) => $request->ip() === '10.0.0.5');
If the provider is not registered at all, no callback exists and the dashboard is reachable only in the
local environment.
The dashboard's stylesheet and script are served without the middleware or the gate, so its own error pages stay styled. They are two fixed files with no data in them.
Moving the dashboard#
REQUIZON_PATH=ops/outbound          # served at /ops/outbound
REQUIZON_DOMAIN=ops.example.com      # served only on that host
Add middleware to the list rather than replacing it, so the routes keep their session and cookies:
'middleware' => ['web', 'auth', 'verified'],
php artisan about prints the path the dashboard is currently served from.